IPUMS Data Extraction System1
by Todd Gardner, Matthew Sobek and Steven Ruggles
Go Back to IPUMS Documentation Index
The Internet data access system we designed for the IPUMS dataseries uses a distributive rather than centralized approach.2 The dramatic rise in the performance of inexpensive desktop computers, along with rapidly increasing capacity of the Internet, has facilitated this alternative way to access large microdata files. Instead of providing tabulated results to the user, the server provides actual individual-level data which the researcher downloads for processing on a desktop workstation. This requires greater sophistication on the part of users because they must be able to use a statistical package such as SPSS, SAS or Stata. The great advantage of this approach is that it imposes no limits on the sophistication of data manipulation or statistical techniques available to the user.
The main goal of the IPUMS is to facilitate the use of multiple census years for historical analysis. It is impractical, however, to distribute a 25-plus gigabyte database such as the IPUMS to the entire research community, despite the increased capacity of both the Internet and desktop computers. To make the database more accessible, we have developed an interactive data extraction system for use on the World Wide Web. The IPUMS Data Extraction System allows researchers to select only those subpopulations and variables needed for a particular analysis. The extraction system creates a single data file containing multiple census years with identical custom record layouts. This allows researchers to fashion smaller extracts of the data specifically oriented to their own research agenda and suited to their available computing power and storage capacity. In practice, researchers never require all variables and all cases from a census year. In the past, however, they have had no choice but to obtain the entire census samples to get the cases they wanted. Now, with the IPUMS extraction system, researchers can design subsamples incorporating a subset of variables pertaining to the specific populations of interest to them.
The Extraction System Interface
The key component of the extraction system is the user interface, developed using Perl and JavaScript programming languages. This system is available on the IPUMS web site and is accessed through the "Data" hypertext link. Before users can initiate a request for a data extract, they must log on to the system by entering their e-mail address. The e-mail address functions as a password but it also provides us with a means of contacting users and constructing a unique file name for output files. Since all e-mail addresses must be registered in order to use the IPUMS Data Extraction System, new users must complete the online registration process before they can request extracts. Once on the system, users proceed through a series of four online steps to request an extract. The options available during each step depend on the choices made in the previous steps. The extraction interface is tightly integrated with the documentation, and contextual online help is available at every stage of the process.
The first choice users make is the density of the samples from which to draw the extract: tiny, small, regular and large. "Tiny" samples are random subsamples of approximately 2000 households, intended for exploratory analysis and instruction. "Small" samples of about 20,000 households run quickly yet are large enough for many research purposes. "Regular" samples include the full-typically 1-in-100-samples from each census year, with the exception of the 1980 and 1990 5% samples which we refer to as "large." By forcing users to confront this choice first, we hope to encourage researchers to begin with smaller, more manageable extracts. The first inclination of most new users is to make huge extracts that contain far more cases and variables than necessary, exceed their processing or storage capacity, or leave out critical variables. The density selection feature also guarantees fairly consistent sample sizes across census years rather than allowing a mixing and matching of densities that would generally not be very satisfactory. The exception is the "large" samples which are only available for the most recent census years.
Once users have selected a sample density, they begin the procedure to request an extract. In the first step of this procedure, users define the general characteristics of their desired extract as shown in Figure 1. They select the particular census sample or combination of samples they want (e.g., 1990 1% metro, or the 1880 general sample). Each sample listed in the variable selection step is linked by hypertext to a brief description giving its general characteristics and special features such as weighting or geographic limitations. The default file structure is rectangular (all household information attached to respective household members) but users may select a hierarchical structure (household record followed by person records), if they prefer. Users can also choose household records only" if their research does not require any individual-level information. A feature allowing continuously variable sample densities will be added in the near future.
Figure 1. Extract System Step One
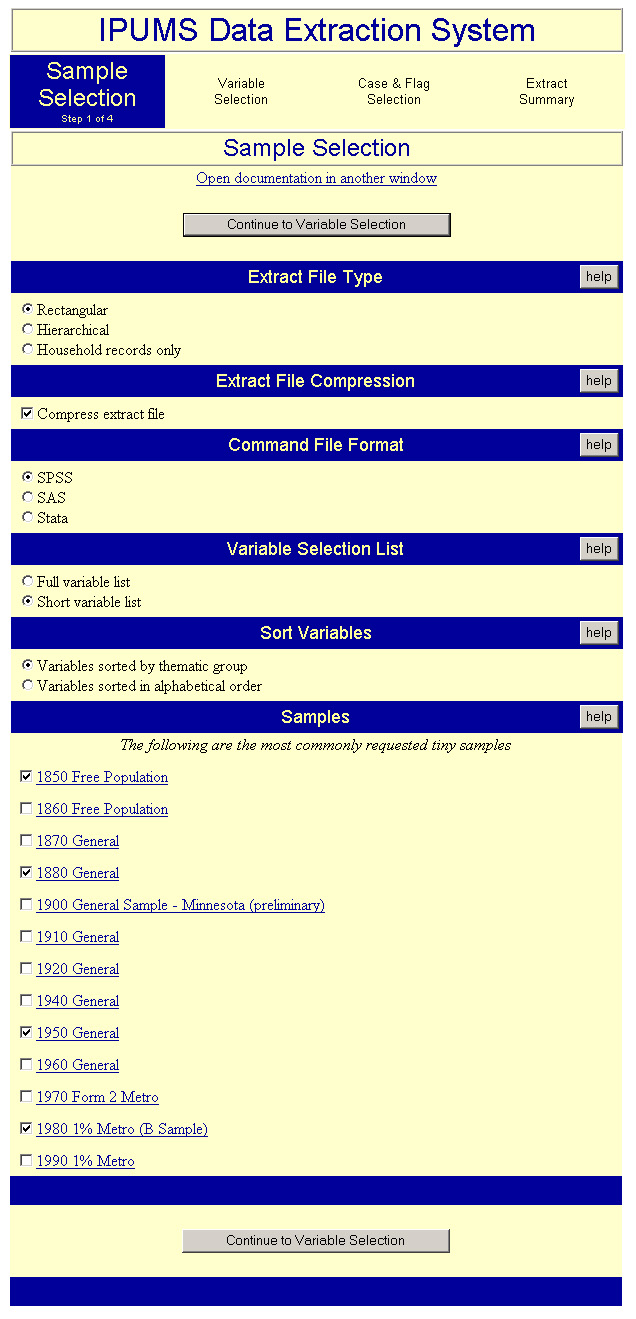
In the example shown in Figure 1, the user has selected samples for 1850, 1880, 1950 and 1980. Because the user selected "tiny" files when logging on to the system, only files of that density are available for selection in this step. The extract will be produced in rectangular format and the output file will be compressed. When the extract has been completed the file will be compressed using the UNIX "compress" command, which is compatible with WinZip. To simplify the subsequent variable selection step, the user has selected the "short variable list" (i.e. the most commonly requested variables). The number of variables available in the IPUMS database is quite large and many of them are specialized and not necessary for typical research questions. Researchers performing more specialized analysis would need to select the "long variable list."
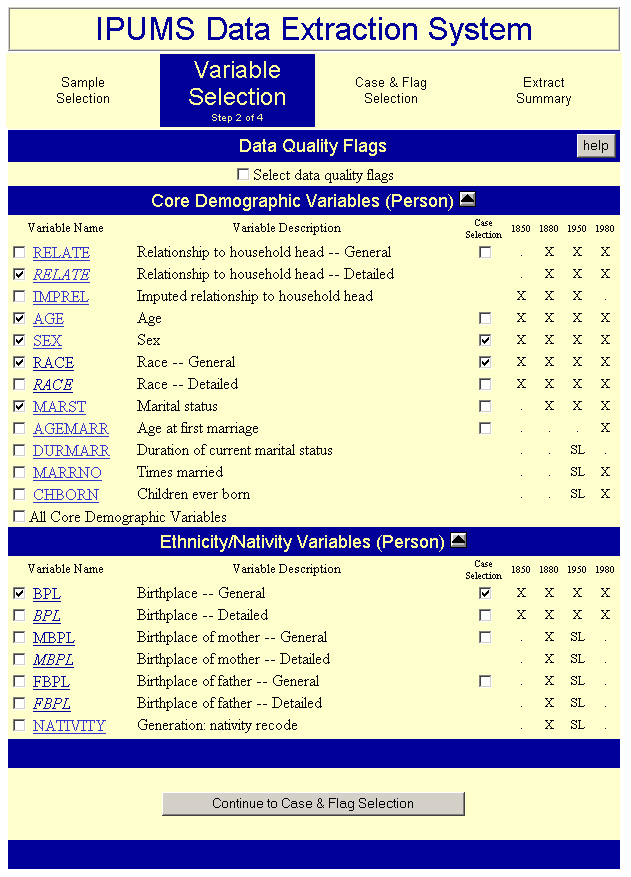
During the second step of the extraction procedure users select the variables to be included in the extract. A portion of step 2 is depicted in Figure 2. Only those variables available for the specific samples selected during the first step are displayed as options. If users selected multiple census samples, all variables that occur in any of the specified samples are displayed on this form available. Most variables have a second check box allowing users to select cases based on values of the variable. Entire groups of related variables can be selected by checking a single box. Researchers can choose to have data quality flags included in their extracts. By selecting the check box on the variable selection page, the user will be given a list of a relevant data quality flags during the third step of the extract request process. Once again, extensive online help is available on this page. Each variable name is a hypertext link to the relevant parts of the documentation.
Figure 2 partially displays the selections available based on choices entered in Figure 1. Each column on the right corresponds to a census year chosen in the sample selection step. Only columns for selected years are displayed along with the symbols showing the availability of each variable across years. For instance, among the four selected sample years, duration of current marital status is available only for "sample-line" persons in 1950. In this example the user has selected the variables relationship to head of household, age, sex, race, marital status and birthplace. In the case of sex, race and birthplace the user has also checked the case selection box, invoking the option of selecting cases based upon particular values for those variables.
Figure 2. Extract System Step Two
The third step, "case and flag selection" shown in Figure 3, allows users to limit the number of cases in their extracts by limiting the ranges of valid values for specified variables. Only those variables chosen for case selection in the second step will appear in the third. User choices are displayed in one of two ways, depending on the type of variable. For variables with only a few values, such as region, the user makes selections from a series of check boxes. With complex categorical variables such as birthplace, values are selected from a scrolling list. In either case, this form displays descriptive value labels as well as numeric codes. The method of case selection processing can also be specified by the user. The system default is that only those cases satisfying the selection criteria for all variables will be included in the extract (that is, applying an AND logical operator between selection variables). Users have the option of including cases that satisfy the case selection criteria for at least one of the variables (an OR operator between selection variables).
The IPUMS extraction system has two advanced case selection features that greatly simplify extracts for many researchers. First, users can select only those individuals with the selected characteristics, those individuals and their family members, or entire households containing individuals with the selected characteristics. For example, one can select families containing unmarried mothers of young children instead of simply selecting the unmarried mothers themselves. Second, ethnicity case selection allows users to select ethnic groups based on all the language and nativity variables: language spoken, mother tongue, mother's mother tongue, father's mother tongue, birthplace, mother's birthplace, or father's birthplace. For example, researchers can select "Norwegian" and all individuals with Norway or Norwegian listed on any variables will be included in the extract.
Figure 3. Extract System Step Three
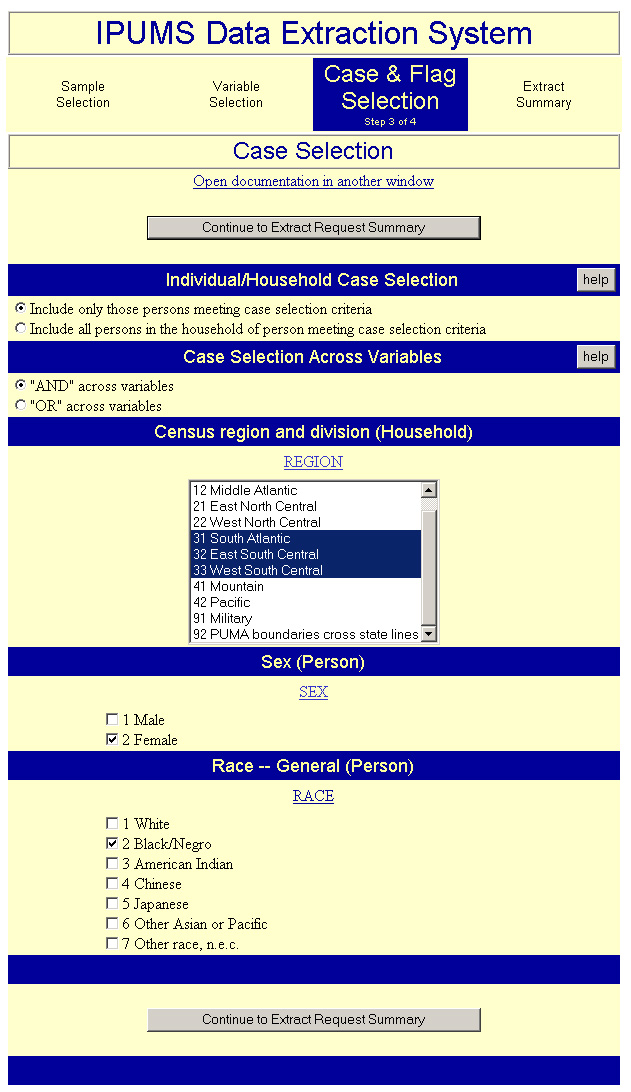
Figure 3 shows the value choices available for those variables with case selection boxes checked in Figure 2. In this example, the researcher has chosen black women who lived in the South in the selected years. The user has also chosen to extract only those women with the selected characteristics rather than including their entire households.
The final step is a review of user selections on a summary screen. The extract request summary page displays the samples the user selected, the characteristics of the output file, and the type of case selection. The page then goes on to list all variables the user selected; data quality flags, if requested; and any case selections specified for each variable.3 If satisfied with the extract request, the user submits it for processing. Users also have the option of including a descriptive label with the extract request. With a click of the "submit" button, the program creates an extract request file that initiates the extract engine.
Extract requests are processed in batch mode by an extract engine written in Fortran. A UNIX shell script manages the requests. The shell script puts extract queries into a queue and runs no more than two jobs simultaneously; in the future we plan to raise this limit as we acquire additional computing capacity. Once each minute, the UNIX system scans for new extract requests. If a new request is present and less than the maximum number of jobs are running, the UNIX shell script calls the Fortran program and passes it the extract request file. The Fortran program interprets the extract request file and reads sequentially through the relevant samples selecting the records and fields that satisfy the request criteria.
The software automatically informs researchers via e-mail when their extracts are completed and provides instructions for downloading their files. In addition to the data file, users receive a codebook describing the extract as well as an SPSS, SAS or STATA command file. These command files contain the column locations of variables, variable labels, value labels for categorical variables and missing values.
Advantages of the IPUMS Extraction Architecture
Our principal design goal was to make extractions easy and yet retain maximum flexibility for users. We have reduced a fairly complex procedure to four simple steps. Using Perl allowed us to construct the form dynamically with the form content at each step depending on the input from the previous page. There are no HTML pages in the entire extraction system. This means that the content of every page is customized to the needs of particular users, which simplifies the process since users are presented only valid choices. For example, researchers who select nineteenth-century census years are not offered variables on the ownership of televisions or automobiles. The Perl script that creates these pages is a recursive program, i.e. a program that calls itself. This design makes system-wide modifications easy to implement and has allowed sophisticated error checking to be built into the system. If a user has made a serious error during any step, the program will reproduce the form for that step with descriptive error messages and the offending field(s) highlighted.
Our use of an extract engine written in a higher-level language adds greatly to the flexibility of the IPUMS extract system. There are now several other extraction programs for large-scale microdata on the Web, including one developed by the U.S. Census Bureau.4 Because the other systems carry out extractions using the SAS or SPSS statistical packages, the flexibility of these systems is greatly limited. For example, they do not allow users to construct extracts combining files from multiple census years or to merge multiple samples from the same census year. Perhaps the greatest limitation of the other extraction systems is their inability to fully accommodate the hierarchical structure of census microdata. Census microdata samples are simultaneously samples of households and of individuals, and within households the interrelationships among individuals are known. This hierarchical structure is one of the greatest strengths of census files. By combining the characteristics of several individuals within a household, researchers can create a wide range of new variables about family and household composition and the characteristics of family members.
Other web-based extraction systems, because of their reliance on statistical packages to do the data extraction, can only work with flat files. For example, the Census Bureau's system does not even allow users to choose household- and person-level characteristics simultaneously in the same extract. Unlike the other systems, the IPUMS Data Extraction System offers users the option of rectangular or hierarchical output files along with household, family or individual case selection based on individual-level characteristics. We are also working on several new ways to make it easier for researchers to exploit the information embedded in the hierarchical structure of the data. These new techniques are described in the next section.
Advanced Extract Features
We are currently developing several features to allow more complex subsample designs and the creation of new constructed variables. These innovations dramatically decrease the need for higher-level programming skills to manipulate the data.
- A method for attaching characteristics of other household members to each individual's record. For example, labor economists often require information on the income and occupation of each individual's spouse. We will provide options for attaching any available characteristic of the household head, spouse of head, subfamily head, own spouse, own mother and own father. The attached information (e.g., spouse's occupation) will appear on the person record as an additional variable.
- A method for counting the number of co-residing persons with any given set of characteristics. Some of these characteristics can define family interrelationships, permitting counts for groups within households such as unrelated persons, family members, or own children. Thus, demographers using own-child fertility methods are able to construct a set of variables giving the number of own children of each age for every mother. An economist can construct variables for the number of employed co-residing kin. The system is also able to sum numeric characteristics (e.g., income or property) of select persons within households. Though complex, the new features will provide ample flexibility for advanced users.
- The capability to save, retrieve, and modify dataset definition files created by the extract query system. Our experience has revealed that users frequently need to replicate their extracts multiple times with only minor modifications. Moreover, investigators often want to recreate precisely the same dataset they used in a prior analysis. Users will have the option of storing their dataset definition files on our server and reading them back into the extract software at a later data. This will automatically fill in all the dialog boxes allowing users to modify their choices before re-submitting the extract.
- A differential sample density feature that will allow researchers to select subpopulations at varying densities. For example, researchers might need to extract a subsample of 1-in-100 blacks and only 1-in-1000 whites in order to create the most efficient sample that would yield statistically significant results for both subgroups. The extract program will assign the appropriate weights to produce nationally representative statistics.
- The capacity to add aggregate contextual variables from other sources. We plan to make aggregate statistics at the level of counties, county groups, state economic areas and Public Use Microdata Areas available to users. Users will, for example, be able to attach county-level information on sharecropping or value of manufactures to each individual record. This feature will greatly facilitate multi-level and contextual analyses.
Current Usage of the Extraction System and Future Expansion
We have prepared approximately 10,000 data extracts since our extraction system went on-line in 1996. The average extract is about 100 megabytes so the volume of data extracted is substantial. From its beginning in May 1996 until the end of 1997, we made the extraction system available to a limited number of researchers for testing purposes. Figure 4 shows the steady usage of the system over that period, averaging about 100 extracts per month. Since the announcement of IPUMS-98 and the transition of the extraction system out of testing mode, usage has soared.
We are now creating over 500 extracts per month and are approaching capacity given our current computing resources. We plan to expand our extraction capacity through two mechanisms. First, we plan to distribute the extraction engine (but not the web interface) to multiple inexpensive Intel-based microcomputers running the Linux operating system. This will allow us to expand the number of simultaneous jobs with no adverse impact on performance. Second, we will mirror our site at multiple population centers around the world so users can go elsewhere if our own server has a long extract queue. If the IPUMS-International project described in Sobek and Ruggles (elsewhere in this issue) is funded, we will undertake a major redesign of the data access system to accommodate the increased complexity of the database. For example, we plan to construct documentation pages dynamically just as we now do with pages in the extraction system. Thus, users will get only the documentation they need for a particular analysis and will not be overwhelmed by a mass of detail pertaining to irrelevant countries and census years. We will also redesign our methods for storing and retrieving microdata in order to maximize efficiency.
We are not, however, locked into a particular design strategy. Statistical software, desktop and server equipment and Internet technologies are changing so rapidly that it is impossible to predict the research environment even a few years in the future with any degree of confidence. Accordingly, we hope to remain open to new possibilities so we can respond to changing needs of researchers and technological opportunities in the coming years.
ENDNOTES:
- This article appeared in Historical Methods, Volume 32, Number 3, Pages 119-124, Summer 1999. Reprinted with Permission of the Helen Dwight Reid Educational Foundation. Published by Heldref Publications, 1319 18th St. N.W. Washington, D.C. 20036-1802. Copyright 1999.
- There are two very different models for accessing large microdata files on the Internet: centralized and distributed. In a centralized system, users request cross tabulations on a remote server and then simply download the results. This is the approach employed by Explore (http://pdq.com/), Ferrit (http://dataferrett.census.gov/), and SDA (http://sda.berkeley.edu). The centralized system requires no specialized software to obtain basic results. It allows researchers to work with large datasets even with limited computing resources and skills or slow Internet connections. The main drawback to a centralized data access system is that analysts cannot do sophisticated data transformations or employ advanced statistical methods. These problems are resolved in a decentralized model, in which users access the system to request data, not computations.
- Soon this page will also indicate the estimated compressed and uncompressed file sizes of the completed extract. Since multiple case selections are possible, there is no way to calculate this analytically; therefore, we are using a simulation method that actually carries out an extremely small extract, and applies the appropriate multiplier to estimate the size of the completed extract.
- One is the Census Bureau "Data Extraction System" for the 1990 1% (http://www.census.gov/DES/ www/welcome.html). University of Virginia Subsetting system: (1990 1%) http://www.lib.virginia.edu/socsci/1pums/sub/pums1.html The other is the University of Calgary "LANDRU" system for the 3% Public Use Microdata File of the 1991 Canadian census (http://www.acs.ucalgary.ca/cgi-bin/landru/index.cgi; no longer available online).
Supported By
![]()
![]()
![]()
![]()
![]()